Submitted by greggles on
One measure of the momentum of the fine Drupal project is the number of people who are creating contributed modules on drupal.org.
The Drupal contributed projects are stored in a system called CVS and data about that is stored in some database tables that keep track of each change by each person. At the request of some fine folks who are working on important things, I got interested in the idea of the trend related to people committing code to the drupal.org CVS server. Here is the data graphed by the number of committers per month. It is not the number of commits, which would show how active those people are, but the number of people which shows how big of a group of people is doing this work.
Also, this is only about the contributed module and theme area and not about Drupal core. Drupal core commits are done by a very small group of people after that small group reviews the code contributed by hundreds of contributers. So, this really shows activity of the non-core projects.
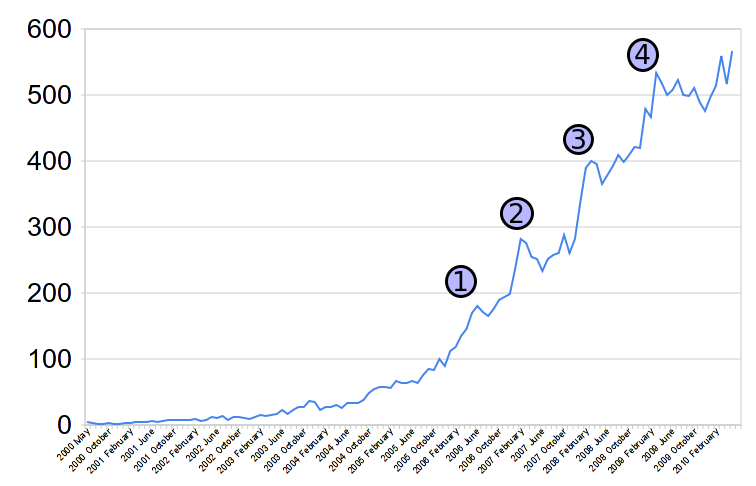
I've labeled 4 points on the graph.
1. 2006 through Drupal 5.0 slump
Point 1 shows a peak at June of 2006 followed by a slow down until the trough at August of 2006 and then some small increases until December of 2006. Then there is a huge increase in people in January and February of 2007 which is also when Drupal 5.0 was released.
2. 2007 Follows a similar contribution trend
Up next is a peak in February of 2007 followed by the valley of the trough in June 2007 lasting roughly until December and then the committers really expanded in January and February of 2008 mirroring the pattern from the previous year.
3. 2008 sees more growth echoing the shape of 2006 and 2007
At point 3 we see another peak in March 2008 just after the release of Drupal 6.0 in February. A trough comes in May of 2008 followed by the big increase in January, February and March of 2009.
4. 2009: a plateau of committers active on drupal.org
And finally at point number 4 we see a peak in March of 2009. The bottom of the trough doesn't come until December of 2009 and then in January, February and March there are monthly increaseses of 3%, 5% and 8% that pale in comparison to the growth of 2008 (8%, 20%, 15% for similar months).
Drupal's contrib audience is growing, momentum has slowed - why?
So, we can see a real increase in the growth of committers to the Drupal contributions code base around 2005. The trend has been rocketing upward in a pretty consistent annual pattern with some minor variations perhaps due to major releases of the Drupal core codebase.
Recently there has been a trend of people hosting code on other sites. Code is posted to places like Github, Launchpad, and other similar sites that offer project pages and issue tracking with a more modern version control system (and without the dreadfully nitpicky CVS review process).
It's also somewhat possible that we have hit the limit of new stuff. There's fewer places for innovation (though I think a chart of projects created per month may prove that wrong).
And then there's also the possibility that the long cycle between Drupal 6 and Drupal 7 has created a lull where people don't need to do work. I certainly feel like many of the contributed modules I maintain are "stable" and don't necessarily need major improvements at this point.
My perspective is that this data provides great motivation for the project to move from CVS to Git and to relax the CVS application reviews in favor of a per-project and perhaps per-release review process.
Previous similar statistics posts
You may also be interested in:
- December 2009: Contributors to Drupal 7.x - End of Code Freeze Edition
- August 14th 2009: Contributors to Drupal 7.x - Code Freeze Looming Update
- December 30th 2008: Drupal 7: Who is Providing Patches for the Next Release?
Edit: Source data now attached.
| Attachment | Size |
|---|---|
| 46.6 KB |
- Log in to post comments